# Dashboard
# Overview
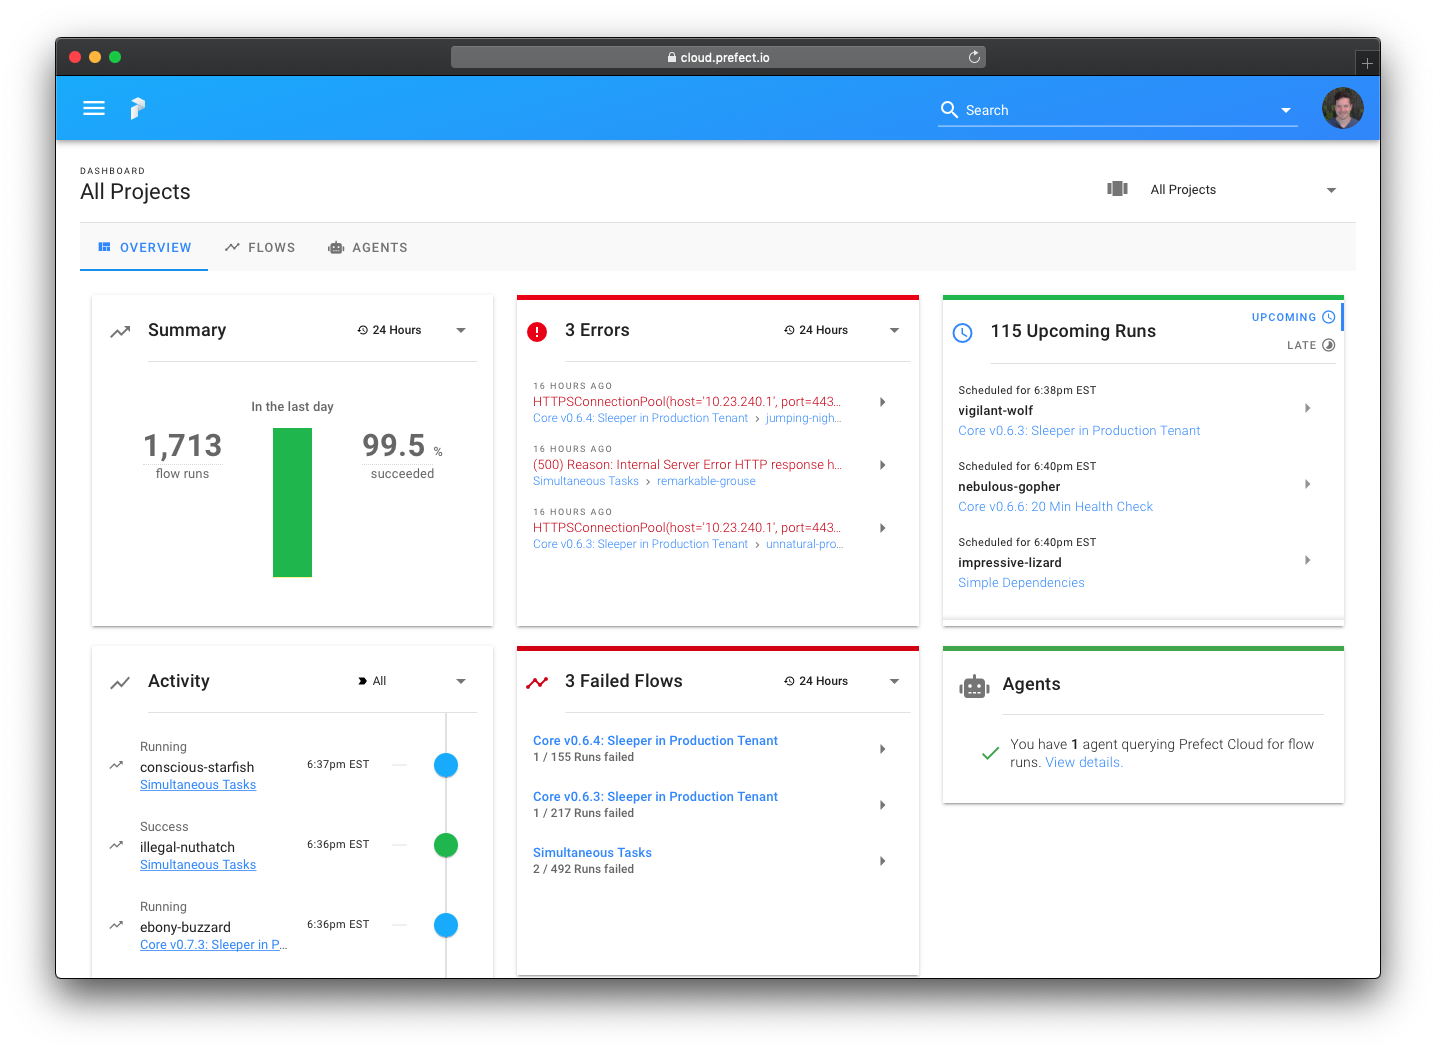
The UI's dashboard provides an overview of all of your flows. It was designed around a simple question:
What's the health of my system?
To answer this question, the dashboard surfaces many insights, including summaries of recent runs, links to error logs, descriptions of upcoming runs (including warnings for late runs), an activity timeline, and (when using Prefect Cloud) agent monitoring.
The dashboard may be filtered by period, starting with the last 24 hours and when using Prefect Cloud it may also be filtered by project.

# Agents Page Cloud
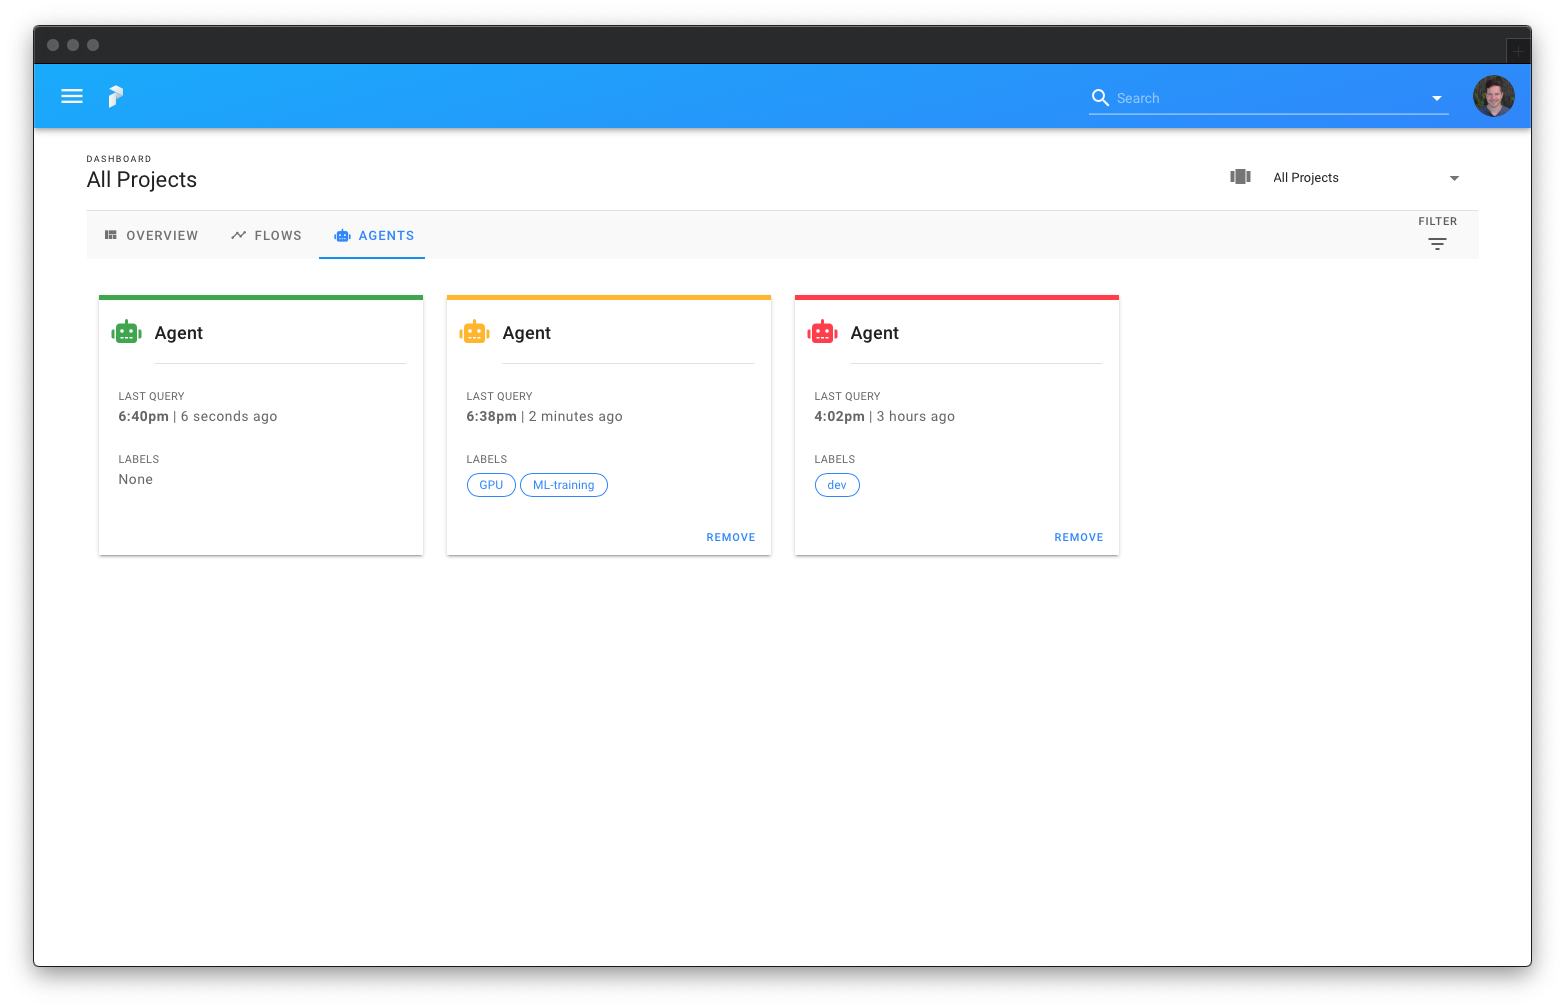
The Agents page shows any Prefect Agents that have recently interacted with your Prefect Cloud instance. Agents are considered "healthy" if they have interacted with Cloud in the last minute (typically, agents ping every 10 seconds), and "unhealthy" after a few minutes have gone by.


